Hunting for Mr Kano

Noriaki Kano is a man worth going out of your way to track down. You’ll need to fly to Tokyo and get on the Tozai metro line until you reach Lidabashi station. From there it’s a short walk over the Kanda River and head for a grey imposing building on the right. If you find Mr Kano anywhere, it will be there, the private research university called The Tokyo University of Science.
But it’s worth the effort because he knows some pretty important information. Information that can help you, if you’ve a genuine desire to improve the experience of your supporters.
I’ve been a devotee of Mr Kano since I first read his work many years ago. Contained deep within his many writings was a model. It was the simplest, most concise and intuitively powerful explanation of satisfaction I had ever come across, or have done since. And although developed to fuel innovation in the motor industry the model holds true for any market – from cars to fast food to banking. And I couldn’t see why it wouldn’t have something to say about the experience of giving to a charity.
The principle of his model is so simple it makes you think there has to be more to it. But despite its simplicity I’ve found it one of the most incredibly useful ways to challenge how we develop supporter experiences and supporter journeys. For those who gain reassurance when something is only complex and intellectually challenging (they’re out there!), then feel reassured – while the model can be applied very simply you can also let the model take you into deeper waters – look out for the zone of tolerance!
I’ll do a walk through of the model some other time but for now it’s worth looking at the underlying consumer truth that the model is based on – that satisfaction is the balance point between expectations and experience. So if a supporter’s expectations exceed their experience they’ll be dissatisfied. And why is that important – because higher satisfaction is an important factor in generating giving behaviour. So treating supporters better will help deliver additional value.
Over the past few years supporter satisfaction and supporter experience has received much more attention, and not a moment too soon! One outcome of this attention has been charities finding new ways to treat their supporters better. But I’d argue that while lots of attention has been placed on the ‘experience’ side of the equation, very little has been done to better understand what supporters expect. Far too often it seems new initiatives and approaches come out of assumptions or perhaps what the fundraisers themselves would like to experience.
As well as a seeming lack of insight from charities there’s also an extraordinary lack of academic published work addressing the area of expectations.
So we’ve been doing a bit of work to explore the area of supporter expectations. What do supporters expect as part of their giving experience? And once you start looking at it the questions keep flowing – such as how and to what extent do expectations differ across demographic groups? Or by media recruitment channel, or by financial value segments? If we knew these, wouldn’t we be better placed to create experiences that matched and even exceed those expectations?
Expectations
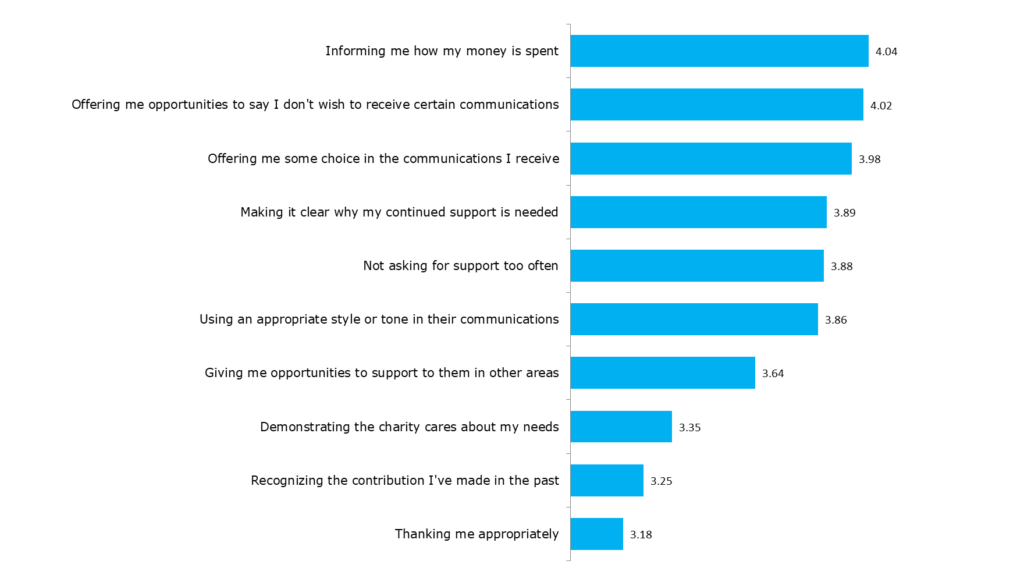
The graph below shows the importance charity supporters place upon different factors of their charity relationships. We based the options given to the public on some great work Bob Francis did while at NSPCC. The research participants were members of the UK public who had given more than three times to any charity in the preceding 12 months.
In order to qualify the result we re-ran the research so that we had two waves of identical research.
The graph below shows the average score the research participants (all charity supporters) placed upon a series of prompted stewardship factors. The higher the number, the greater the importance supporters place upon it.

Based on the factors we investigated (initially defined by NSPCC) I failed to find even a weak correlation between age and the importance placed on how they were treated.
So if there appeared to be little difference between ages perhaps we would find greater differences if we looked at affective loyalty. We’ve been measuring and incorporating commitment (our measure for affective loyalty) as a means of segmenting supporters for many years and know it to be a vitally important factor in someone’s propensity to support. We calculate someone’s commitment score as a combination of six factors that relate to their evaluation of their stewardship experience.
To understand the role commitment may play in supporter expectations rather than use ‘cold’ research participants we carried out the research among the supporters of a large UK charity. To find differences we expected we would need a sizeable data set, so in the end we gained scores for over 11,000 active supporters.
The role of commitment on supporter expectations
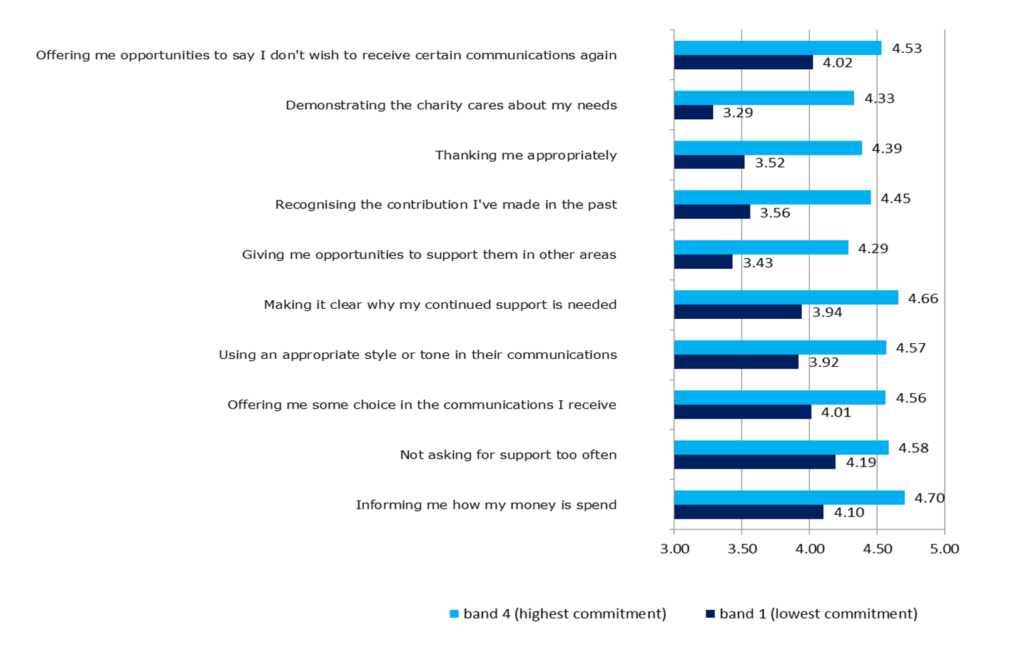
The graph below shows that those with higher commitment (band 4) placed more importance on each and every factor, compared to those with the lowest commitment (band 1).

It’s worth noting that the correlation between commitment and a supporter’s expectation is strong, as shown in the table below. Interestingly the correlation between commitment and how supporters perceive their experience (the reality) is less strong but still very significant.

Why’s this important?
The data supports the idea that those with lower commitment aren’t necessarily upset at how they’re treated but that the relationship is simply of less importance to them, and therefore factors within the relationship are less important. Put simply they are just less engaged rather than more disappointed by how they are treated.
Now whether they have always been disengaged OR have become disengaged overtime, and as a result of a charity experience is another issue for us to explore!
Net experience by commitment
To support this idea of those with higher commitment placing more importance upon how they are treated we wanted to see how this related to their evaluation of how the charity performed on these factors. Put simply, do those with higher commitment score the charities performance differently?
The chart below displays how supporters score they gave the charity for its performance against their expectation. (Note – we took a weighted sample of the data to simplify the demonstration).

Image a line running bottom left corner to top right corner. Those supporters who are to the right of that line have expectations which are higher than their performance. I’ve then colour coded the supporters depending upon their commitment band – 1 being the lowest to 4 the highest.
The pattern strongly suggests that those with the highest commitment have both higher expectations of the charity, but also score the charity better for its performance.
One key insight is that while we may have expected those with lower commitment to judge the charity more harshly (that they perceive their experience less positively), we’ve learnt that they are seemingly less engaged in being a supporter.
As an aside, this method of evaluating a supporter’s expectations against their evaluation provides an interesting way to understand how you can identify supporters for whom you need to deliver a better experience – especially those who are highly committed due to their far greater propensity to leave a legacy.
An implication of identifying less engaged supporters is that it challenges perhaps one of the unspoken assumptions around how we create supporter journeys. The assumption that everyone should be treated as though they have the potential to become a loyal supporter. Or to put it another way – we’re delivering experiences that don’t reflect someone’s expectations.
And that’s something Mr Kano wouldn’t approve of!